Many of you know I’ve been working complex restaurant analytical roles and engagements since the early 1980s. I’ve seen over that time advances in restaurant management systems, technology and data gathering has expanded exponentially. Restaurants today of course are complex blend of people, brand building and management systems bundled together; the outgrowth of this is numbers have become incredibly important.
Unfortunately, a series of suboptimal restaurant analytical viewpoints, reporting and practices continue to be seen. The same issues seem to carry over from decade to decade. Such perspectives result in confusion; lack of lessons learned and misdirected effort. Here are five that I see regularly, and suggested solutions are posed.
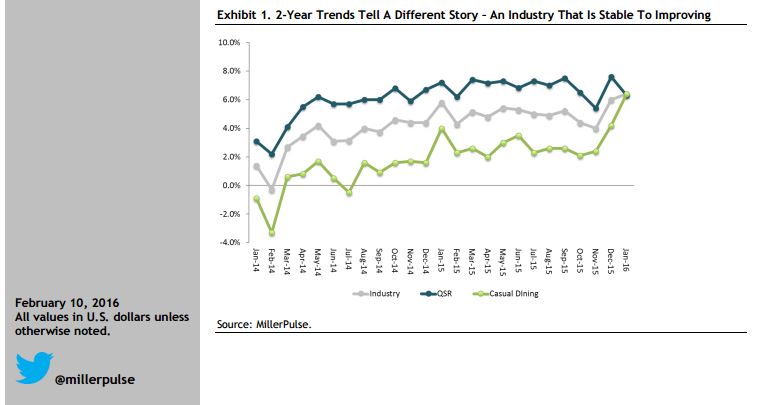
- The comps trap. Everyone talks and worries about comps. Same store sales are typically calculated as percentage change of average unit sales over prior year period, for the units in the mature, “comp sales store base”. The press and investor community keys on it, a lot of decisions are driven by the comp. The problem is of course is that a one year view over last year is really a tiny snapshot. Let’s face it, weather, menu platform changes, competitive intrusion, national and global events happen every day. A better practice is to consider and report two year or even five year comps. This measure can be either “stacked” (values added together year after year) or on a compound annual growth basis (CAGR). If the sell side analysts keep focusing on the one year comp, report the longer measures anyway.
As an example, look at the very current extract from the February 2016 Miller Pulse report, which shows the industry comps strengthening, not weakening, on a two year basis, versus the flat to negative January 2016 trend on a one year basis. A vastly different two year view!
Restaurant Monthly Same Store Sales through January, 2016
- Transactions v. traffic v. customer count. Of course, the amount of traffic the restaurant generates is a vital number, which drives food prep and staffing in store. But is it people, entrees or number of times the grand total key on the POS was hit? Restaurants chains report it all differently. For drive thru or catering transactions, it might be hard to know exactly how many customers are served; for bar only customers, there might be many seconds or thirds served. Is each a transaction? Both Panera (PNRA) and Zoe’s (ZOES) have gotten into trouble with this lately; in 2013 and 2014 Panera had rising entrée counts but reported the number “parties”, that is the number of times the grand total key was pushed on the POS was down. Zoe’s had good comps but flat traffic because catering was up. Was that really a problem? If Panera got big table sizes in, they didn’t get credit for it, and the Investment Community became worried.
The practice that Ruth Chris (RUTH) utilizes is pretty simple; report the number of entrees sold as a proxy for customer count. A conversion factor for catering can be set (and updated annually), drive thrus might be too hard, but every sophisticated QSR brand has the ability to track the number of “menu units sold” and can be noted as color in earnings calls.
- Dollars versus percentages: restaurant managers are taught percentage analysis early on; a fantastic amount of discussion and attention throughout the industry occurs to food cost and labor percentages; percentage restaurant margins are discussed endlessly. Investors get percentages but have to be told a fuller story. Sometimes, merchandizing and even refranchising decisions are justified on a percentage basis; e.g., the franchising margin percentage is greater than that of operating a restaurant. But what about the dollars?
A unit with high profit percentages but low dollars profit per store is not the goal. A percentage is simply one number divided by another, it is a just a relative measure. The problem is of course percentages can’t be taken to the bank. The powerful effect of average ticket and gross profit cents per customer is not recognized if the focus is to percentages. The suggestion is to supplement “profit cents per customer” or even average weekly store contribution margin dollars per week as metrics, something to get the focus on dollars.
- Misleading marketing event analysis. A lot of promotional events are underway right now, one QSR brand is running three concurrent major promotional efforts (for example, Restaurant Brand’s International’s Burger King (QSR) is fighting the burger wars) that makes it confusing to detect what worked.
There are a multitude of improvements possible in restaurant marketing analysis. First, brands can find and set a control market and measure impacts to remove “noise” from the promotional review. Not all brands do so. Secondly, more attention to measuring the AUV impact after a promotional window ends is needed. Restaurants are open long after the promotional event ends. In my thirty plus years, I’ve rarely seen reports of the “post promotion lift”. And if the marketing event media spend is expensive, advertising expense over and above plan should be treated as a variable expense and subtracted from the sales lift and other variable expenses in figuring out whether the event worked. And finally, the promoted item hit rate itself is interesting but unless it drives sales and profits higher, it is just an incomplete metric. It is not the measure whether the media worked. To its credit, Burger King, which just announced its Hot Dog rollout, tested the dogs in five markets and had a control market. Honest testing and data gathering does wonder in building credibility in a franchised system and in a company operated system to read and learn from the results.
- Remodel tracking and the first year sales pop: sales are vital of course, and remodels typically (but not always) drive incremental sales. But for how long? The first year lift gets all the attention (example, Wendy’s reported this week its Image Activation (IA) program returns are now lower than what they started with) but incremental sales and profit flow through are needed for years thereafter.
To be sure, stores that aren’t remodeled will trend negative over time, so the change from doing nothing (negative AUVs) to the actual lift is fairly included in the sales and profit lift analysis. Setting the right analytical perspective is also important in the heavily franchised brands; the franchisees fund the CAPEX. Answers like “remodeling is in the contract, so we won’t talk to that” (see Dunkin Brands example) is not productive. For example, to its credit, in 2015 and 2016, Panera (PNRA) had excellent displays of the sales and profit impact of its Panera 2.0 initiative that helped explain a very complex undertaking. Suggestions: keep and track the multiyear sales and profit lift trends, publish to franchisees for their planning.
About the author: John A. Gordon is a long time restaurant analyst and management consultant. He founded Pacific Management Consulting Group in 2003 and works complex restaurant strategy, operations and financial management analytical engagements.